TickerSage
Access live Binance cryptocurrency and stock candlestick charts featuring extensive technical indicators, drawing overlays, and flexible timeframes. Analyze markets with real-time data, professional-grade charting tools, and automated historical backfills. Educational only; not financial advice. Key Features · Live market data: Stream real-time candlestick data for Binance crypto pairs and major stocks with full pan, zoom, and auto-update functionality. · Professional timeframes: Choose from 13 intervals ranging from 1-minute scalping views to monthly trend charts. · Advanced technical studies: Layer over 50 indicators including MA, RSI, MACD, Bollinger Bands, and Fibonacci retracements with customizable parameters. · Drawing and annotation: Mark support and resistance, draw trend lines, and add text notes directly onto the chart. · Versatile styles and zones: Select from multiple chart styles like hollow candles or OHLC bars, and sync to your local worldwide timezone. More
@TickerSage Check BTC's real-time price

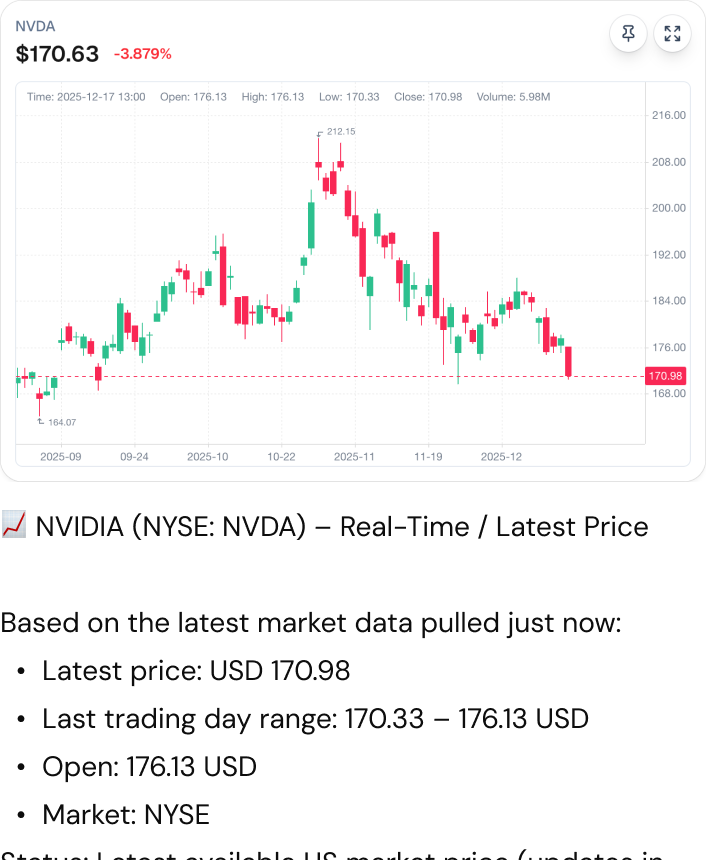
@TickerSage Check NVIDIA's real-time price
@TickerSage Add BOLL, MACD, and KDJ indicators
